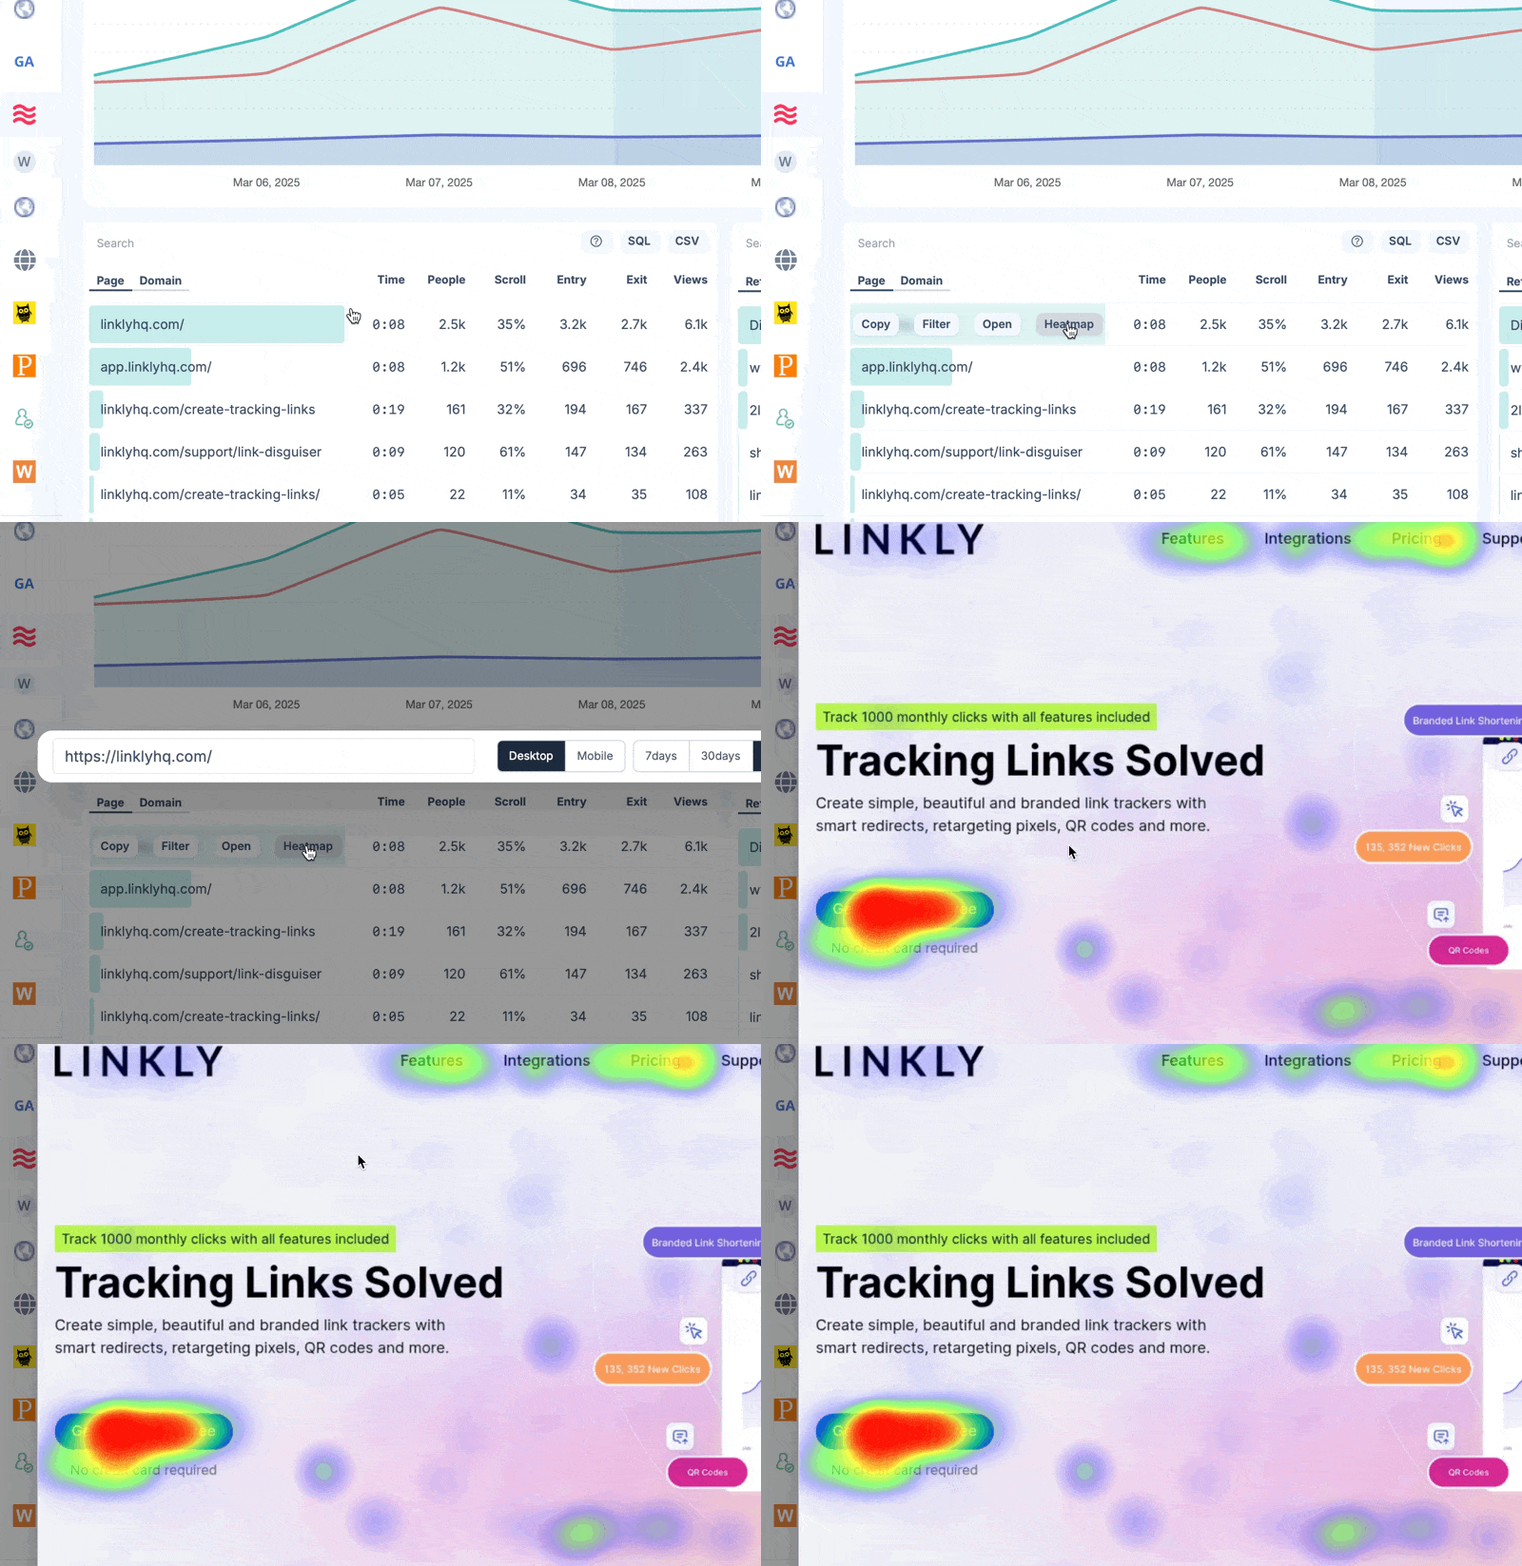
Click Heatmaps
Glass's click heatmaps, sometimes called click maps, are an innovative, visual way of understanding user behavior on your site, by showing you exactly where users engage and click, and helping you identify weak spots for improvement.
Glass automatically records click heatmaps for every page of your site, both for mobile and desktop.
How to Generate Click Heatmaps
Enter your site in Glass
You'll need to have been collecting data for at least a few days before heatmaps will be useful.
Hover over the URL in the pages table
The Heatmap button will appear.

Click the Heatmap button
A modal window will appear with the heatmap.
It may take a few seconds to generate a screenshot. Glass can only generate screenshots of publicly accessible pages. If pages require a login, Glass will not be able to see them to generate a screenshot.
Accessing Heatmaps#
From the Dashboard Tables
When viewing page data in tables that support heatmaps, you'll see a "Heatmap" button when hovering over URLs in the table.
Using Heatmaps#
Key Features
1. Device Type Selection
- Desktop Shows click patterns for users on larger screens (default width: 1440px)
- Mobile Shows click patterns for users on mobile devices (width: 375px)
2. Time Range Selection
- 7 days
- 30 days
- 90 days
3. Session and Click Data
-
Sessions
The total number of user sessions included in the heatmap data
-
Clicks
The total number of clicks recorded across all sessions
4. Color Intensity
- Blue areas: Fewer clicks
- Yellow/orange areas: Moderate click activity
- Red areas: Highest concentration of clicks
Interpreting Heatmap Data#
What to Look For
-
Click Clusters
Areas with high click density (red/orange) indicate elements that attract the most user attention.
-
Ignored Areas
Blue or empty areas suggest content that users may be overlooking.
-
Device Differences
Compare desktop and mobile heatmaps to identify usability issues specific to certain devices.
-
Time-Based Changes
Use different time ranges to see how user behavior evolves over time, especially after website updates.
Common Insights from Heatmaps
-
Navigation Effectiveness
See which menu items or navigation elements users click most frequently.
-
Call-to-Action Performance
Determine if your CTAs are attracting sufficient attention.
-
Content Engagement
Identify which content sections users interact with most.
-
Dead Clicks
Spot areas where users click but nothing happens, indicating potential usability issues.
Best Practices#
-
Compare Multiple Time Periods
Look for changes in user behavior over time.
-
Cross-Reference with Other Metrics
Use heatmap data alongside conversion rates, bounce rates, and other analytics.
-
Test Hypotheses
If you notice users aren't clicking on important elements, consider design changes and use heatmaps to validate improvements.
-
Segment Your Analysis
Look at heatmaps for different user segments (new vs. returning, by traffic source, etc.) when possible.
Troubleshooting#
-
Check Time Range
Ensure you've selected a time range with sufficient data.
-
Verify URL
Confirm the URL is correctly formatted and accessible.
-
Browser Compatibility
Try accessing the heatmap in a different browser if you encounter display issues.
-
Data Volume
For pages with very few visits, heatmap data may be limited or unavailable.
Summary#
Heatmaps provide valuable visual insights into how users interact with your website. By regularly analyzing heatmap data, you can identify opportunities to improve user experience, optimize conversion paths, and make data-driven design decisions.
Use this powerful feature to go beyond traditional analytics and truly understand the "why" behind your website's performance metrics.
Frequently Asked Questions
For what pages are heatmap data available?
We record heatmap data for every page of the site.
We display data for heatmaps for up to 90 days in the past.
We can only generate screenshots for pages that are publicly available. We cannot generate screenshots from pages that require a login to access.
How is click data processed?
We select data up to two maximum resolutions - 1440px for desktop and 375px for mobile, with a 10% tolerance.
We round clicks to the nearest 5px.